$3,000 Gold, Strong Unemployment Report, 1970s Playbook, Fedwatch Updated, Gold and Silver Charts
Weekly Recap for the Week Ending February 23, 2024
Domestic
1. Citi Says $3,000 gold is possible in 12 to 18 months
Citi analysts predict a massive surge in gold prices – potentially hitting $3,000 within the next year or so.
This could be triggered by central banks buying more gold, economic turmoil, or a severe global slowdown.
Central Bank gold buying
Citi analysts believe gold could hit $3,000 an ounce if a few things happen. First, countries need to rapidly shift away from relying on the US dollar. This could cause a crisis in the dollar, making gold much more attractive.
This shift would also mean central banks worldwide would buy massive amounts of gold to diversify their holdings. This gold-buying frenzy could make prices soar.
We're already seeing signs of this trend. Central banks have been buying record amounts of gold recently, especially from China, Russia, and others. If these purchases suddenly double, Citi believes it would be a major boost for gold prices.
Global recession
Citi sees a few ways gold could hit $3,000. One is a deep global recession forcing the Federal Reserve to slash interest rates dramatically. Lower rates make gold more attractive compared to bonds, boosting its price. This scenario isn't very likely, though.
Another possibility is stagflation – think high inflation, slow growth, and rising unemployment. This kind of economic turmoil makes investors seek safe assets like gold. But Citi analysts think this is also unlikely.
It's important to note, that even with these potential triggers, Citi's baseline prediction is for gold to be around $2,150 in late 2024, with prices averaging slightly lower earlier in the year. We may see a new record high by the end of 2024.
2. Strong unemployment data
The percentage of unemployed Americans didn't change in January, staying at 3.7%. This is slightly better than expected. However, fewer people were actively looking for work and the total number of employed people shrank slightly.
Source: U.S. Bureau of Labor Statistics
The unemployment rate in the United States held at 3.7% in January 2024, unchanged from the previous month and slightly below the market consensus of 3.8%. The activity rate was also flat at 62.5% last month, remaining at the lowest level since February 2023. The number of unemployed individuals decreased by 144 thousand to 6.12 million, while the count of employed individuals dropped by 31 thousand to 161.15 million.
Keep in mind these numbers are always revised down at a later date. Economists prefer the Establishment Survey, shown here because its numbers are “verifiable.” What they don’t tell you is the numbers are easily manipulated. Self-employed, farm workers, people dropping out, etc. are not counted.
Since the focus is on jobs, not people, we don't know from the Establishment Survey alone how many people are working multiple jobs to make ends meet.
So much money has been pumped into the system since 2020 that it is taking time to burn off. We had EIDL, PPP, student loan forgiveness, rich unemployment benefits that sometimes exceeded regular pay, and payment deferrals on car loans and mortgages. There has been too much money in the system which is why we don’t see high unemployment numbers yet.
Workers are bearing the brunt of economic uncertainty. Rising costs and fears of a recession are leading companies to announce layoffs in an effort to cut expenses.
Companies announcing job cuts in February:
BuzzFeed 16%
Rivian 10%
Cisco 5%
Instacart 7%
Mozilla 5%
Grammarly 230
DocuSign 6%
Amazon 400
Snap 10%
Zoom 2%
Polygon 19%
Unemployment always starts out low and then it skyrockets… without exception. This happens every single time.
Ronald Reagon, the Great Communicator, once said:
Recession is when your neighbor loses his job. Depression is when you lose yours.
That simplifies what recession truly is – it’s about people losing their jobs. Economists can argue over definitions, but we know what recession is when we feel it. Recession and job losses are coming, we just aren’t feeling it yet.
3. CME FedWatch Chart
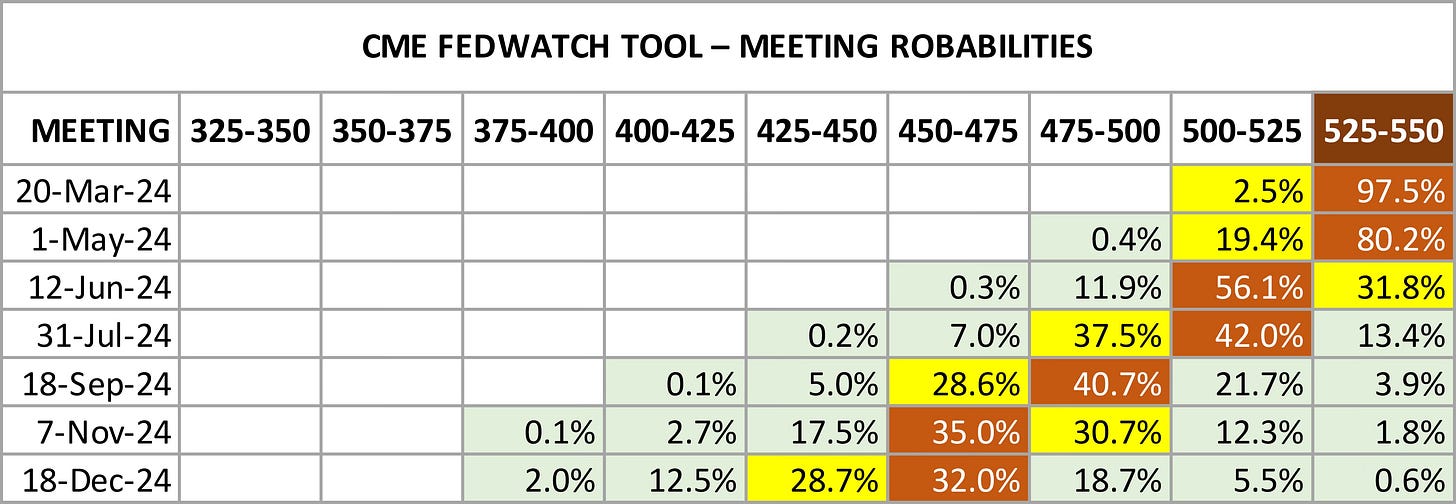
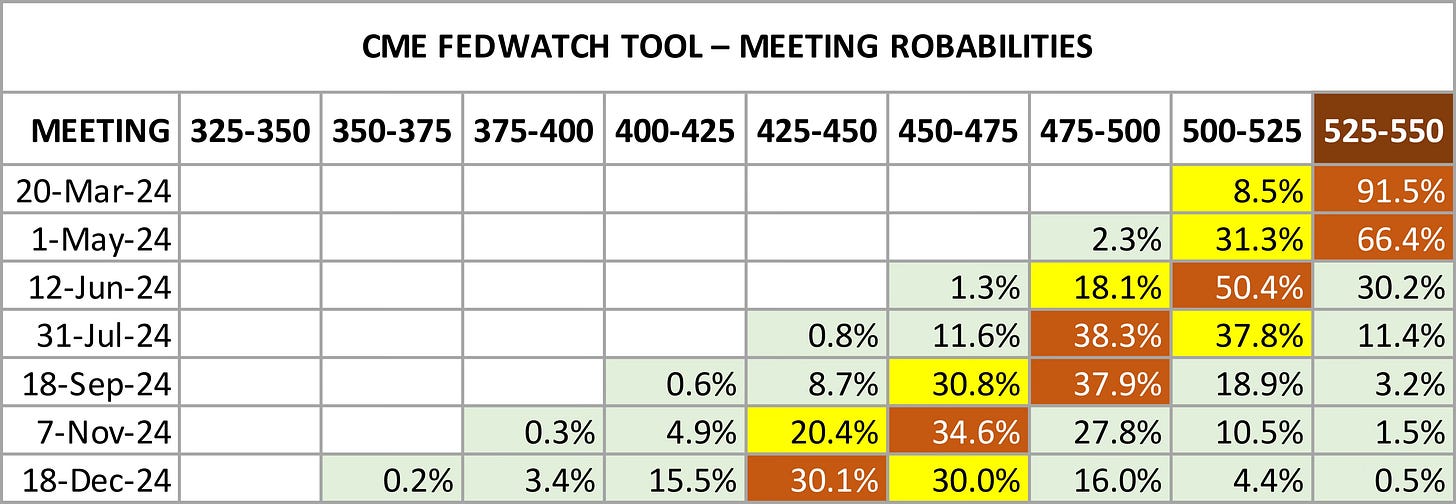
The CME Group continues to reduce the probability of interest rate cuts soon. March and May are off the table. The first hopes of a rate cut are in June with a 56.1% probability of cutting 25 basis points. Compared to last week’s chart, probabilities of rate cuts continue to move to the right, indicating lower probabilities.
4. Gold and silver charts
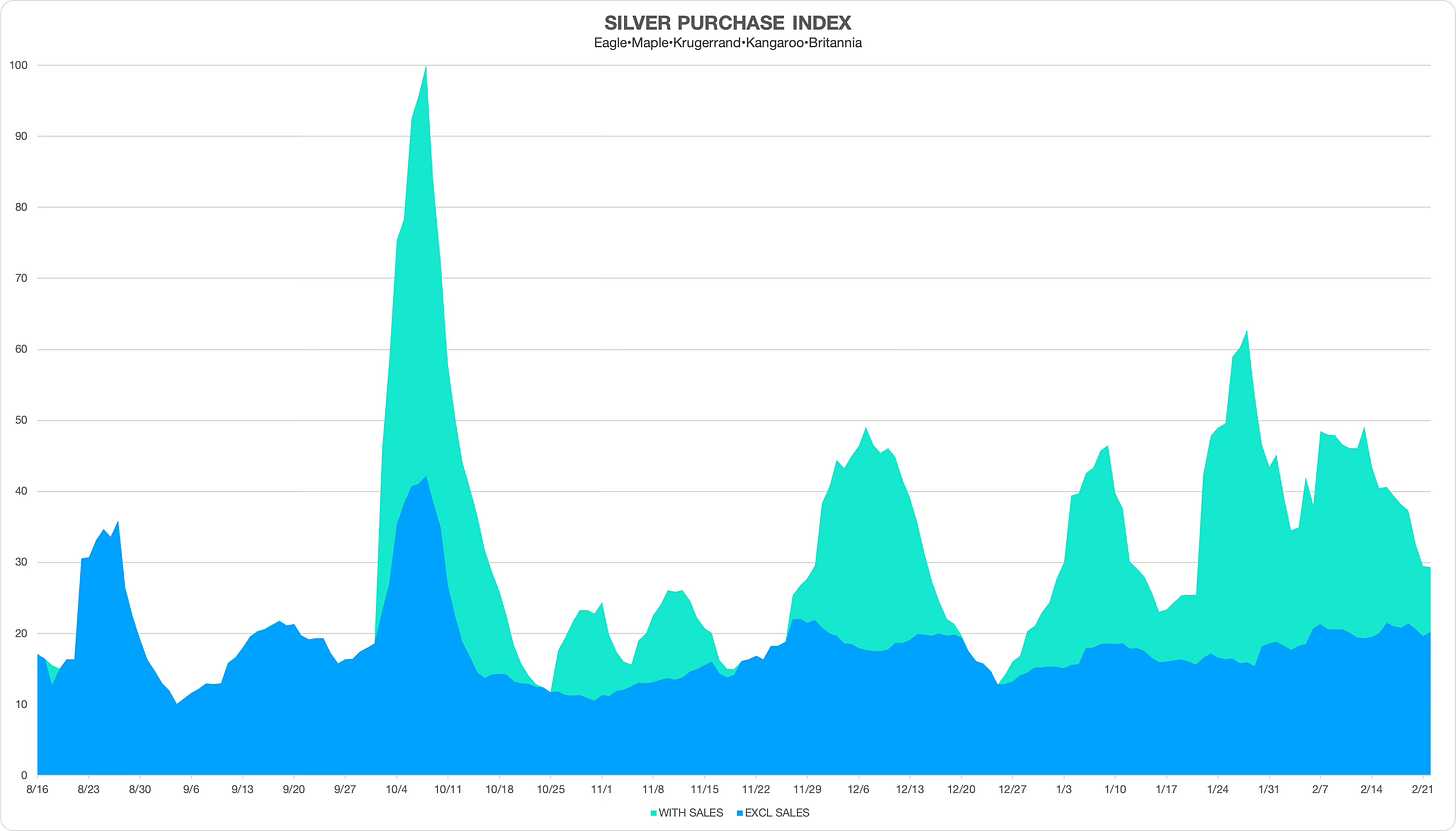
We’ve seen some pullback in online dealer discounts in premiums, indicated by the green-shaded area. The blue shade shows the volume of regular-priced bullion coins, which have remained rangebound since early January.
A reduction in discounted premiums volume would potentially indicate a change in the trend toward higher premiums. Watch out for that.
5. New chart–The 1970s Playbook
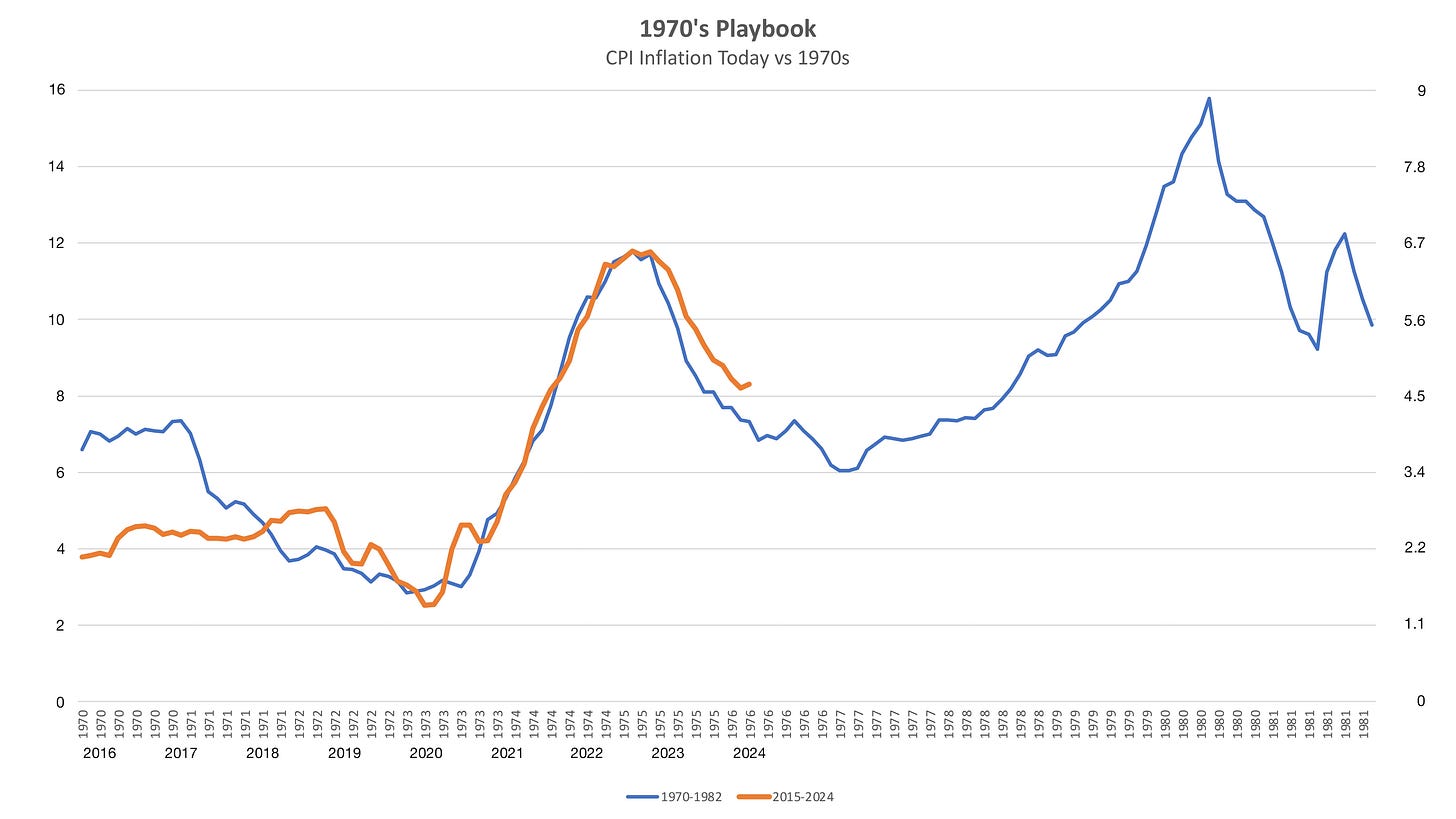
This chart will be a regular feature on The Pipeline. I just posted this article detailing what it’s all about. To recap, today’s inflation shown in red overlays 1970s inflation shown in blue. If this scenario continues to play out then expect inflation to bottom at around 3 to 3.5% and then whipsaw back up after 2 to 3 years. We’ll keep this chart updated as the Fed updates its inflation data.
Disclaimer: City Stacker is intended to provide general information and personal opinions related to disaster preparedness and investing in precious metals. I am not a certified financial planner (CFP), chartered financial analyst (CFA), or a certified public accountant (CPA). The content of this publication should never be considered a substitute for professional financial advice. Before taking any action based on anything within this publication, you should always consult with a qualified financial professional familiar with your unique situation. Investing involves risks, and I am not liable for any investment decisions made or results obtained from the use of information in this publication.


