Gold Buyers are Struggling, FedWatch Says June/July Rate Cuts, Gold and Silver Charts
Weekly Recap for the Week Ending March 29, 2024
1. Gold buyers are struggling with these prices
A look at the Gold Purchase Index chart at the bottom of this article is telling. The surge in spot gold prices this month has not only made it more difficult for buyers but has also moved many to the sidelines hoping for a pullback in prices. Volume is high for gold when it’s on sale but otherwise, regular-priced items are seeing a reduction in volume.
This is in contrast to what some gold sellers have been claiming would happen as precious metal prices surge, that gold would act as a Giffen good. A Giffen good is a product that people consume more of as the price rises and vice versa—violating the basic law of demand in microeconomics. Those gold sellers have been hyping precious metals saying that demand volume would increase as price increases. Guess they were wrong.
Costco drops prices
We witnessed a phenomenon this week on Costco Gold. After nearly two weeks without American Gold Eagle coins in stock, we finally got the stock alert on Thursday… the same day that gold hit an all-time high. Gold Eagles were priced at $2,299.99 which looks like a lot however spot gold closed at $2,245.80 that same day. Taking into consideration credit card and Costco rewards that final price works out to $37.80 below spot. Compare that to APMEX’s cash/wire price of $2,372.29.
Two unusual factors stand out here. First, unlike typical releases which have sold out within minutes, these Gold Eagles remained readily available overnight. Secondly, and even more surprising, Costco reduced the price by $30 just two days later, despite a closed US gold market and unchanged spot prices. This puts Costco's all-in price at a significant $67.80 below spot.
Check out my 40 Emergency 'Go Bag' Essentials From Amazon
2. CME FedWatch chart
The new chart is missing data for November but I think we assume it is pretty much the same as the previous week. We seem to have a stable pattern now with red squares remaining to the right, indicating lower probabilities of additional rate cuts beyond Powell’s three cuts in 2024.
The most likely scenario is one rate cut in June or July and then two more in September/December for three cuts totaling 75 basis points.
3. Gold and silver charts
Gold
Without sales (green shade) the volume of gold buyers would continue its decent from February highs. Spot gold price has increased by 9% in March making it increasingly difficult for investors to stack the physical metal.
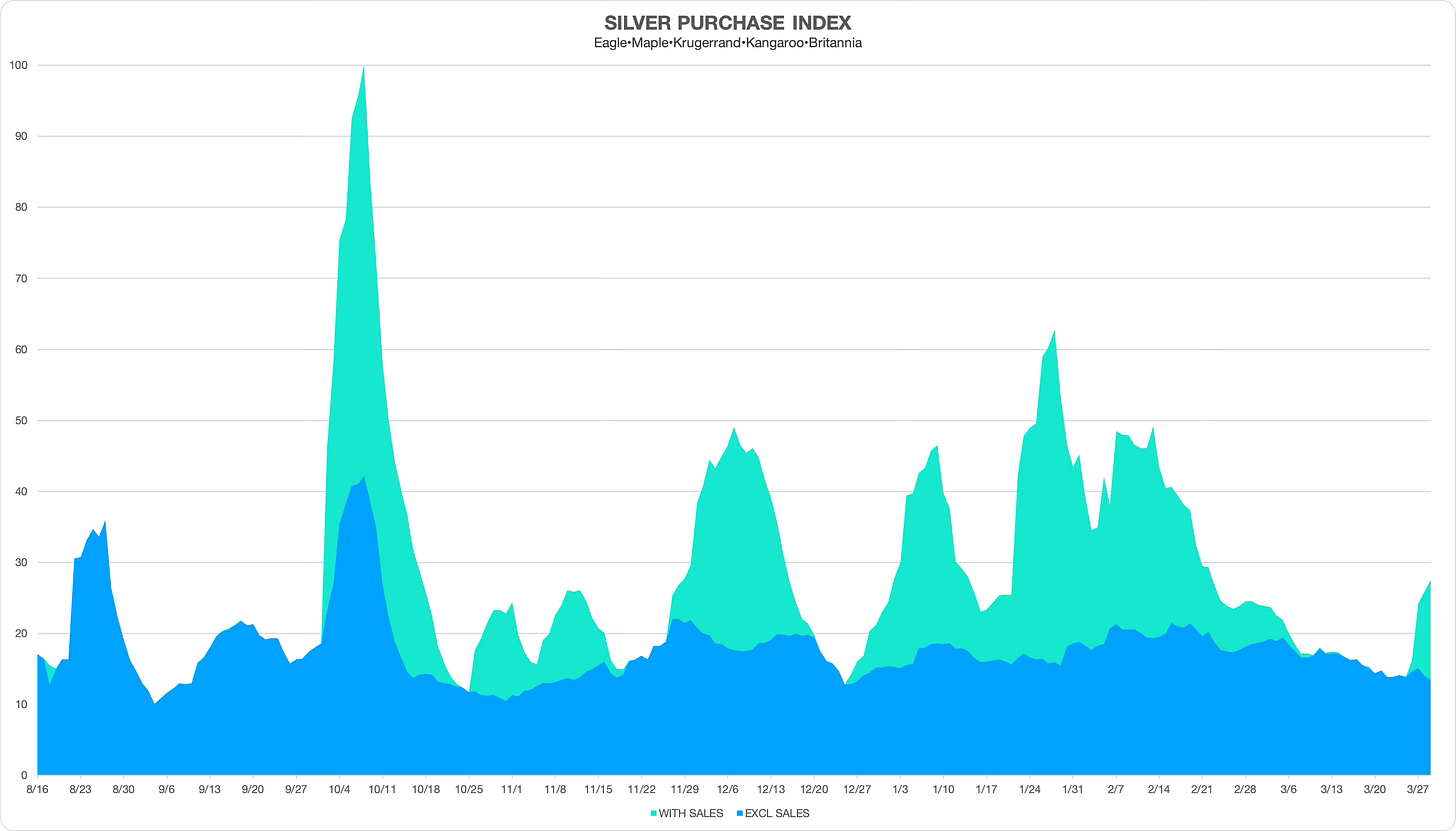
Silver
We’ve seen some pullback in online dealer discounts in silver premiums, indicated by the green-shaded area. The blue shade shows the volume of regular-priced bullion coins, which have remained rangebound since early January.
Silver bullion coin action remained muted with only moderate sales for nearly a month.
Disclaimer: City Stacker is intended to provide general information and personal opinions related to disaster preparedness and investing in precious metals. I am not a certified financial planner (CFP), chartered financial analyst (CFA), or a certified public accountant (CPA). The content of this publication should never be considered a substitute for professional financial advice. Before taking any action based on anything within this publication, you should always consult with a qualified financial professional familiar with your unique situation. Investing involves risks, and I am not liable for any investment decisions made or results obtained from the use of information in this publication.


