Saudi Arabia Shifts From Oil to Ore, Doomsday Preppers Like Gold, Layoffs Slow, FedWatch, Gold and Silver Charts
Weekly Recap for the Week Ending March 15, 2024
1. Saudi Arabia plans to dominate mining
Saudi Arabia has set its sights on becoming a dominant force in the global mining industry. The country possesses a wealth of mineral resources, and it aims to leverage these resources to play a key role in the ongoing shift towards renewable energy sources. This ambitious plan involves capturing as much of the mining value chain as possible, from extraction and processing to refining and manufacturing.
However, there are significant hurdles that Saudi Arabia needs to overcome. One challenge is the lack of a skilled workforce in the mining sector. Additionally, the country has limited water resources, which are essential for many mining processes. Despite these obstacles, Saudi Arabia remains confident that its strategic investments and meticulous planning will propel it to the forefront of the mining industry.
Source: Inside Saudi Arabia’s plan to dominate mining
2. CNBC claims gold has only risen 1% in last century
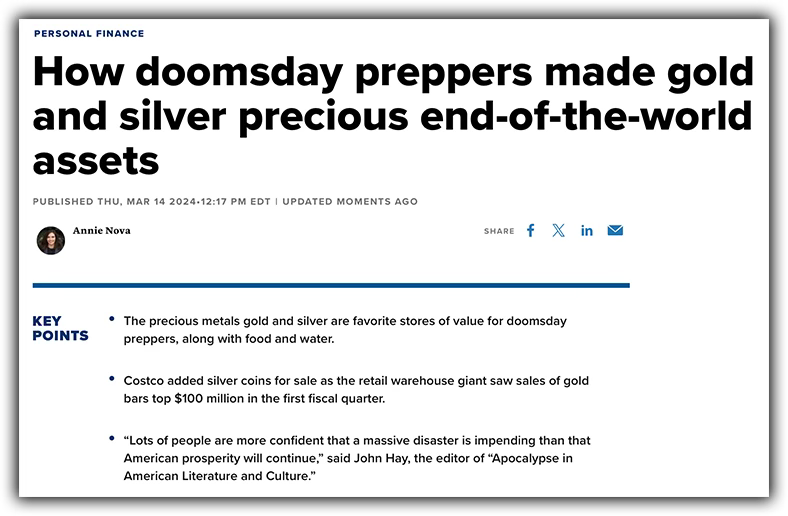
Annie Nova for CNBC offered the following article for us to consider. Like many people who don’t understand gold and why people want to stack the precious metal, she falsely claims that gold has only increased, on average, by 1% since 1924. The author makes this false claim by citing another article without doing her due diligence. Let’s do that for her now.
In 1924 the price of gold was fixed at $20.67 per ounce before getting repriced by FDR in 1933 to $35, and then allowed to float by Nixon in 1971. Yesterday’s closing gold price was $2,168.80 per ounce.
Calculating Compound Annual Growth Rate (CAGR) is simple using those three numbers and the formula:
CAGR = (Ending Value / Beginning Value)^(1 / # of Years) - 1
CAGR = ($2168.80 / $20.67)^(1 / 100) - 1
Which yields a CAGR of 4.76% over the last 100 years, not the 1% that Annie reported. How could she have gotten it so wrong?
One could only speculate, but I think framing the article in the way she did by associating gold investors with extreme doomsday peppers gives us a clue. That is an attempt to discredit gold as sound money and to discourage investment in tangible assets that preserve our wealth. The author apparently would have us rely on the state and its money-printing machine to secure our futures.
Since Jan 2000, gold has yielded a CAGR of 8.89%. With facts free of bias we’re better able to decide our future for ourselves.
Source: How doomsday preppers made gold and silver precious end-of-the-world assets
Check out my 40 Emergency 'Go Bag' Essentials From Amazon
3. Layoffs continue to slow
Rising costs and fears of a recession are leading companies to announce layoffs to cut expenses. So far, March is seeing a reduced velocity of layoffs compared to prior months.
Companies announcing job cuts in 2024:
March
Stach: 25% of workforce
Inscribe: 40% of workforce
Our Next Energy: 13% of workforce
Project Ronin: 100% of workforce
Pristyn Care: 7% of workforce
February
Fisker: 15% of workforce
Electronic Arts: 5% of workforce
Sony Interactive: 8% of workforce
Bumble: 30% of workforce
Expedia: 8% of workforce
Finder: 17% of workforce
Buzzfeed: 16% of workforce
Rivian: 10% of workforce
Farfetch: 25% of workforce
CISCO: 5% of workforce
Wint Wealth: 20% of workforce
Away: 25% of workforce
Instacart: 7% of workforce
Mozilla: 5% of workforce
Riskified: 6% of workforce
Wisense: 100% of workforce
Everybuddy: 100% of workforce
CodeSee: 100% of workforce
Grammarly: 230 employees
Docusign: 6% of workforce
Amazon: 400 employees
Snap: 10% of workforce
Twig: 100% of workforce
Okta: 7% of workforce
Zoom: 2% of workforce
Polygon: 19% of workforce
4. CME FedWatch chart
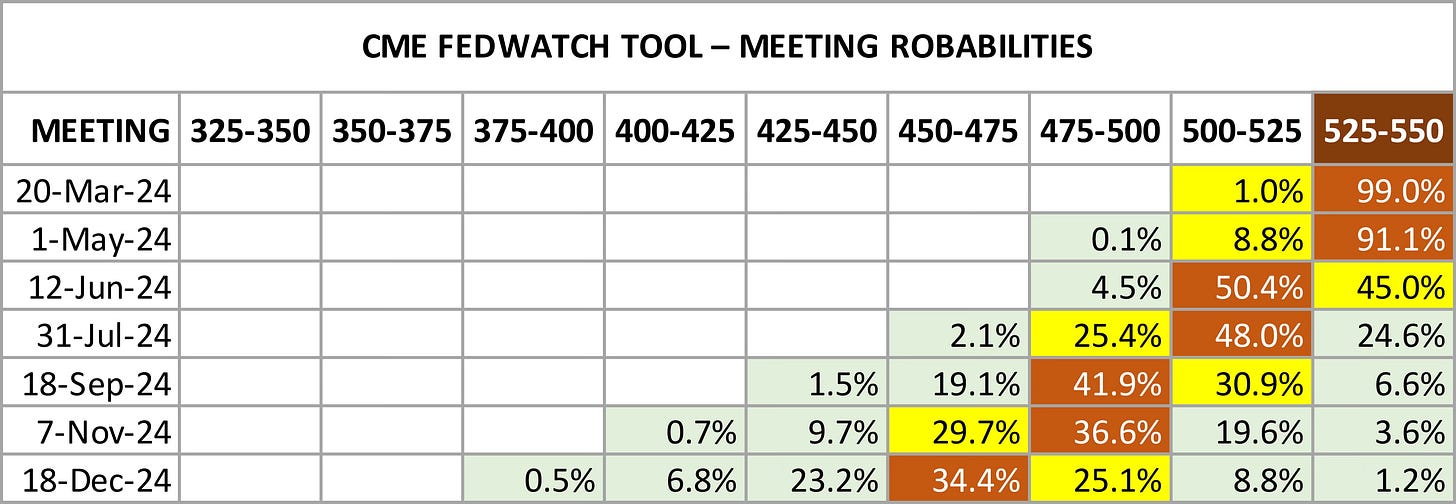
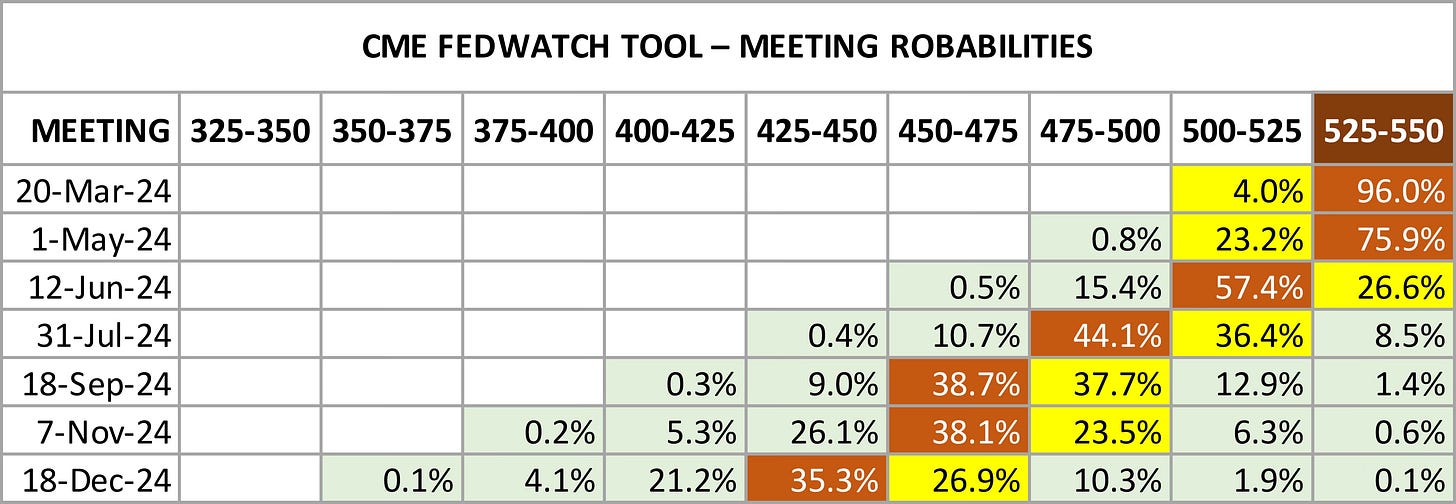
Red squares continue moving to the right, indicating lower probabilities of upcoming rate cuts. Several recent inflation signals indicate the Fed will have to maintain rates higher for longer. Rate cuts as early as June may be off the table. It also seems increasingly likely there will only be three cuts this year totalling 75 basis points.
5. Gold and silver charts
Gold
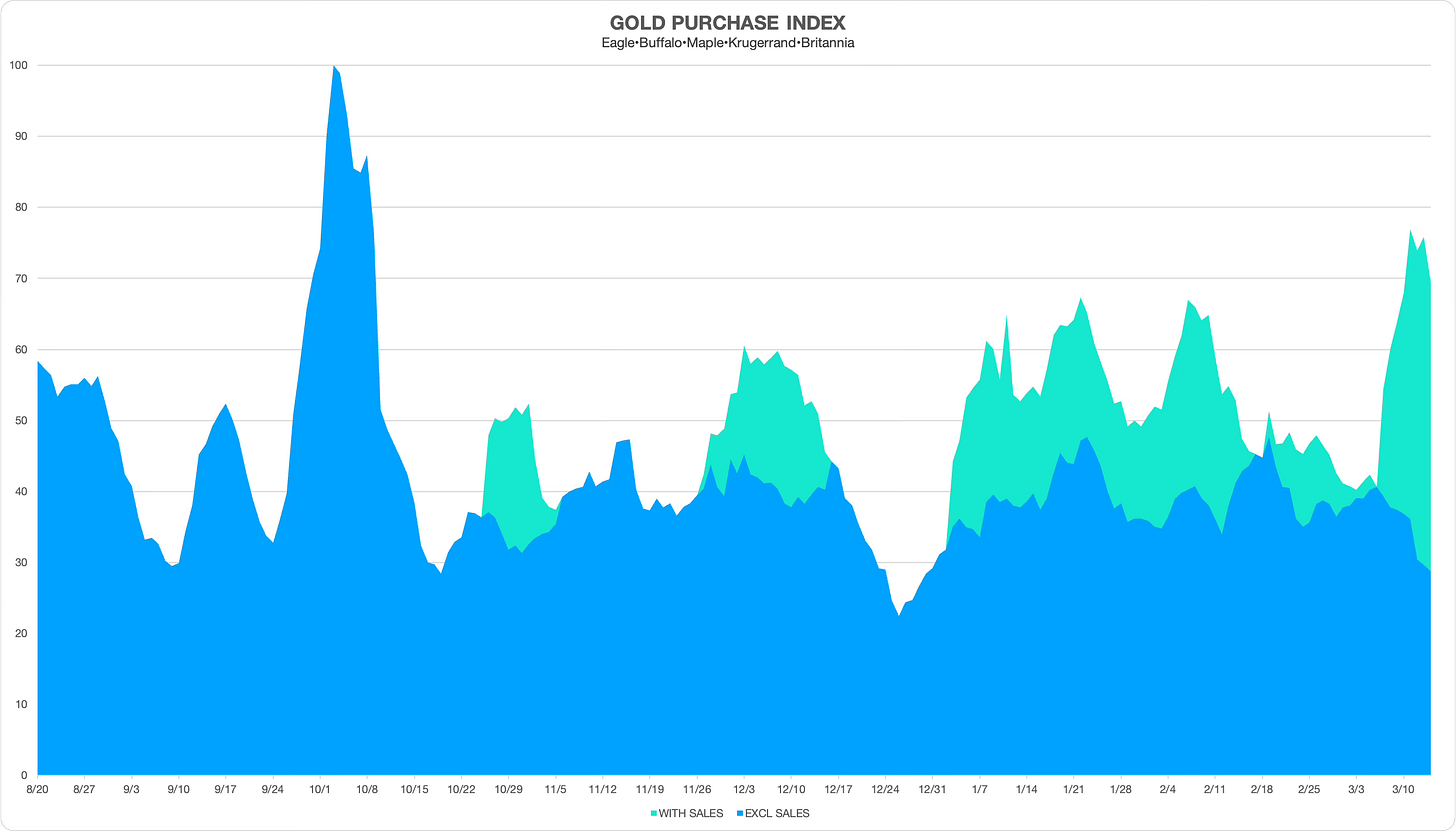
Fueled by FOMO, gold buyers eagerly snatched up available inventory despite limited gold coin sales events. During the week volume spiked in discount-priced coins while remaining steady on regular-priced products.
Silver
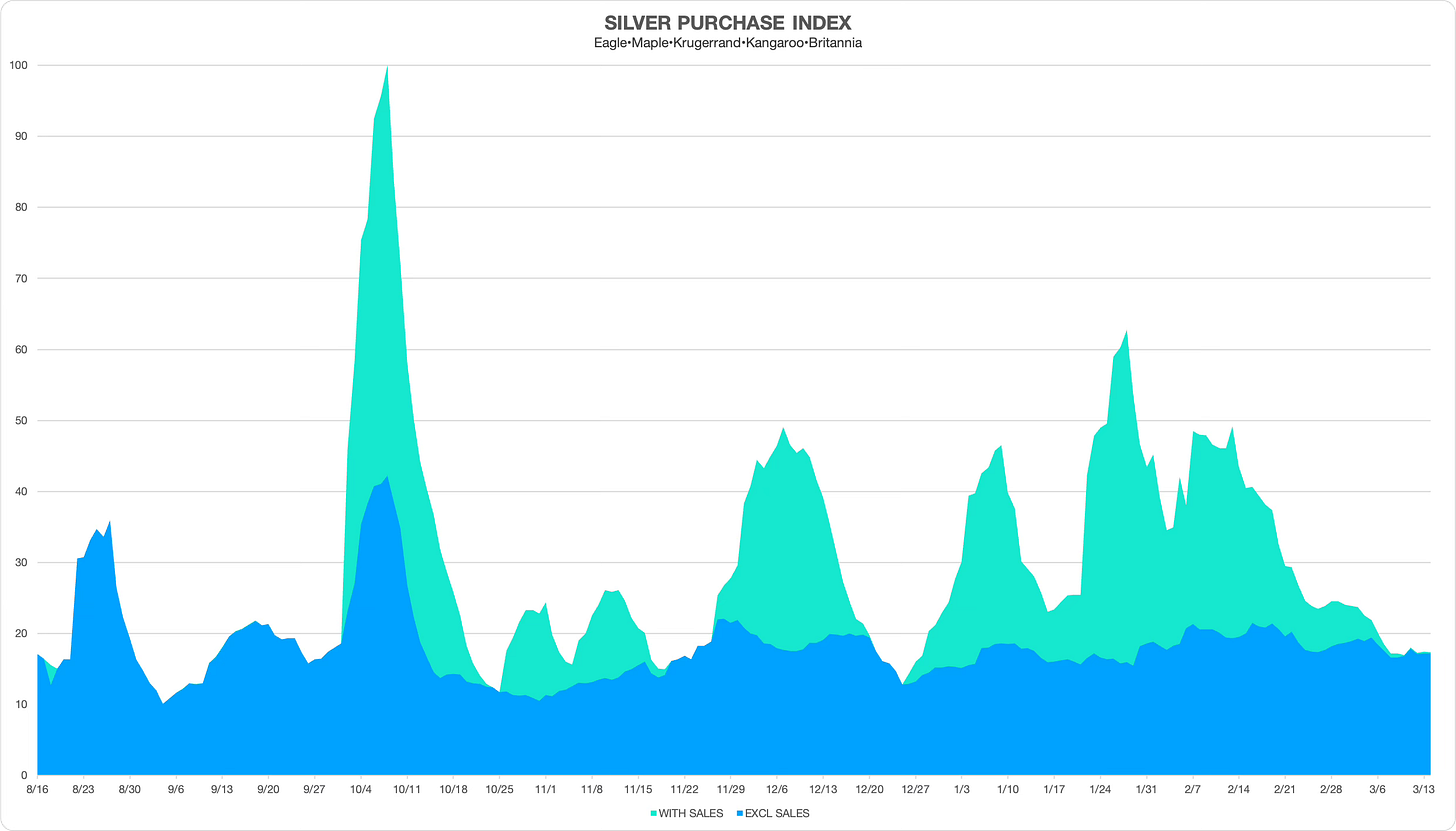
We’ve seen some pullback in online dealer discounts in silver premiums, indicated by the green-shaded area. The blue shade shows the volume of regular-priced bullion coins, which have remained rangebound since early January.
With gold’s recent surge to all-time highs buyers we eager to jump on gold deals, as indicated by the green peak to the right side of the chart. Silver bullion action remained muted.
Disclaimer: City Stacker is intended to provide general information and personal opinions related to disaster preparedness and investing in precious metals. I am not a certified financial planner (CFP), chartered financial analyst (CFA), or a certified public accountant (CPA). The content of this publication should never be considered a substitute for professional financial advice. Before taking any action based on anything within this publication, you should always consult with a qualified financial professional familiar with your unique situation. Investing involves risks, and I am not liable for any investment decisions made or results obtained from the use of information in this publication.


Based on $20.67 in 1924 and $2168.80 in 2024, I get a return of 4.76%/year. I am an actuary and I don't know where she gets 1%?